")
A performance testing results report is crucial for knowing the areas of defects and improvements in the software. Performance testers are responsible for reporting credible information about the applications and systems they run tests on, and in doing so, must use an effective approach.
Any wrong or misleading information about the website’s readiness or system application could spell doom on so many fronts for the company, financially, socially (brand reputation), and possibly, the viability of the company. A performance testing results report template is an essential tool in collecting precise, infallible, and valuable metrics for further analysis.
As a professional software testing company, our team will be sharing with you some experience of how we report performance testing results – in this article. These are proven strategies which we use when providing performance testing services to our clients.
To be clear, throughout this article, the term “performance test” describes any test that conducts experiments on a system chiefly to spot limitations and errors, using different ranges of values considered as benchmarks for acceptance or rejection.
Let’s start by exploring the benefits of reports for performance testing.
Why Do You Need a Performance Test Results Report?
Here’re a few advantages to know:
- Reports empower QA teams to report problems in real-time.
- They consolidate disparate communications into one central channel.
- We eliminate duplication of effort through reporting.
- Reporting allows QA teams to collaborate and track the path to resolution, ultimately reducing expenses.
- This practice enables two-way communication with responders.
Challenges QA Teams Face When Reporting their Performance Testing Results
Nonfunctional tests are hard to report: Obtaining a performance testing results report is no easy task. Infact, it is relatively easier to get a legit result report when performing a proper functional test than in a non-functional test like performance testing.
Functional tests have a clearcut pass or fail outcome and routine steps to take, pending the final result. In performance or non-functional testing, reporting for a similar work requires much more attention to detail.
Basically, the measurement of any non-functional requirement falls under this category, and it is critical to individual strategic decisions being made and implemented.
The first milestone in this performance testing is deciding what is considered a “pass” in the test, and more often than not, this step is overlooked in the phase where all requirements are defined.
Ill-defined benchmarks: When a requirement reads something along the lines of, “Data extraction time approximately (ETA) from the database will be less than 10 mSec”, which is more commonly seen most of the time.
Such a requirement should be deemed as incomplete, as the specific benchmarks to aim at, for maximum and minimum, are not really given. It can only be said that the worst considerable result that would get the build disapproved and sent back for re-working is given, and nothing else.
One problem with giving such specification is this; assuming a test was run and discovered that the ETA was 9 mSec (recall that according to requirement, it’s supposed to be less than 10), one would say that the build is in the right spot. Still, looking closer, you’d realize that this product barely matched up to par and is 1 mSec to falling off the edge.
On the contrary, if the initial benchmarks were adequately defined and given a specific target, let’s say 5 mSec, and also a minimum of 10 mSec, then one can see clearly that the build with an ETA of 9 mSec barely passed the test and will be readily discarded if the rest of the products actually hit the target.
Another problem with the method of giving requirements, as stated above, is that it is inappropriate for whenever a build fails marginally.
Let’s say it hits at 11 mSec; the build manager may be pressed to approve the said product as such, owing to “flexibility.” But if the specifics were clear-cut and given a target, it would be easier to tell how far out from the target the build’s ETA is, and such won’t be taken lightly.
It’s also important to know that the non-functional requirement mustn’t only be restricted to point out the target and minimum benchmarks, but also the methodology of testing since the test method implemented dramatically influences the results.
Every step in a performance testing results report is essential, not just to make the right decisions but also to achieve a successful project. Some of the popular steps are Discovery, Modeling, Developing Scripts, and Executing tests.
To get it accurately, these steps require both skilled expertise and a good deal of experience.
Recommended: Functional Vs Non-Functional Testing: From A to Z
What’re the Requirements for Reporting Results of Performance Tests?
One of the most popular methods of visualizing and analyzing test results is graphs and tables. However, graphs should not be mistaken for a complete report, as it is only a tool for proper reporting.
Traditionally, a good number of load testing tools have some graphing capability by default. Anyone who operates the tool will have to be skilled at properly translating the data relayed through the graphs. They should be great at finding out what is important and what is not, and at the same time, at present the feasible information, broken down so that stakeholders and all the teams involved can easily understand it.
Hypotheses should be drawn and fact-checked by the person or group performing the test, leaving no stones unturned as to what information will be required to support or debunk them. QAs should do this and set up good visuals that confirm the report and show a good representation of the system performance and issues.
To do this, some necessary technical know-how is a prerequisite to have a better grasp of things like;
- architecture;
- hard and soft resources;
- garbage collection algorithms;
- performance of the database;
- characteristics of the message bus;
- a few other components of a complex application.
It’s important that one gets to know when exactly the load on a system build makes it start lagging in speed. On the same hand, getting to know how, and the real reason for the lagging in system performance: what are the limiting factors? What are the characteristic ranges in restructuring and scalability of the build – this data is feasible to become information. It will most likely take a while to acquire this skill and expertise in recognizing trends and system patterns, and that learning remains a constant process due to the broad spectrum of that field.
Some other Socio-Political and communication skills are also required to understand what the demands of the stakeholders are, and what they’d like to hear, this involves asking questions like:
- Who are these results meant for?
- What software testing metrics are useful to them?
- How do they want the information to be presented?
- How is it possible to recreate the narrative so that everyone on the team works hand in hand towards succeeding?
How to Report a Performance Test Result
As the spotlight of the project’s success or failure, it is important for the project manager and team to relate the exact state of events while guiding the team with feasible feats to convert findings to plans, and plans to actions.
As overwhelming as it seems and difficult to pass down knowledge how best one knows how to, the project manager isn’t tasked with the burden of doing it all alone, and that is where the developers, stakeholders and other teammates come in to assist in reaching the maximum possible heights on the test. The steps go as follows;
- Collecting
- Aggregating
- Visualizing
- Interpreting
- Analyzing
- Reporting,
Or CAVIAR as an acronym.
1. Collecting
Collecting data from tests already performed can go a long way in validating results and also double checking for Errors (Where, When and What type), Patterns to take note of (Unwanted or Wanted), etc. Having to take necessary measurements from time to time, after short intervals can be of good assistance in spotting one-off patterns and conditions that require attention.
2. Aggregating
Simply put, this means an assemblage of measurements, making use of different granularity levels to provide a general and collected view, while taking note of the specific differences that keep recurring, making sure that documentation is accurate to the latter. Under aggregating falls useful statistics and numbers used in data transfer and distribution; Minimum and Maximum Range, Difference, Percentage, etc
3. Visualizing
Visualizing, as briefly discussed earlier, is all about making a detailed graphic indicator to better explain what was undergone during the testing process, not as a full report but to compliment a much more detailed analysis. In fact, Gartner’s report shows that by 2023 graph technologies will empower 30% of global organizations’ decision-making process.
4. Interpreting
This means explaining or translating what is observed in such a way that the layman can make sense of it by making verified data off of concrete observations and hypotheses. Below are a few procedures that can be followed:
- Making properly analyzed objective observations from data provided / graphs with no determined certainty at this point!
- Compare and contrast various graph data and discuss findings with the rest of the team.
- Create tentative conjectures (hypothesis) from already discussed findings
- Test the conjectures and reach an acceptable conclusion within the team. Also examine the arrived conclusion with other external teams, supported with additional information where needed.
- Turn verified conjectures into valid conclusions.
5. Analyzing
This has to do with checking where objectives are achieved and deciding on what should be done following the findings.
Acceptable and feasible proposals that highlight the benefits of doing it, and risks of forfeiture, should be introduced at this point, to be discussed with and reviewed by the technical team members that will be undertaking the process.
6. Reporting
This has nothing to do with sending out bulky report articles and expecting the recipients to go through it and understand it themselves.
Instead, this has everything to do with writing reports, presenting results, sending out summarized versions in emails and also having oral report sessions.
Instead of writing a whole boring essay, or letting other people do the interpretation of your own work, take your time to author the short narrative in the best possible way you can…It will be worth it, because that is what people end up paying attention to.
What Should be Top of Mind?
Here are crucial aspects to consider when reporting performance testing results.
1. Adoptability
Have an adaptable report that contains and monitors results of previously released versions and changes undergone (major and minor) on different levels and test indicators, to aid easier and faster comparison side by side.
2. Visualization
Adding visualized effects to the report can assist in making the presentation more comprehensible. By simply highlighting or marking specific areas you can bring attention to them to quickly identify and differentiate the crucial points and note issues.
3. Findings
Findings should be relayed immediately after the tests are concluded, preferably through an automated method to save time in the creation of the task and reporting. This is a crucial step as most of the team awaits it from the onset.
4. Geography
When Geographical locations differ, which is common in larger tech businesses, it’s advisable to have the report correctly shared in a mutual location, so that it can easily be accessible to stakeholders, and have them scrutinized further.
5. Detailing
Clarity and Conciseness are also key factors that go a long way. Reporting the results with too many irrelevant details, no matter how thorough, will only make it bulky and boring to read. The test team and reporter will have to be careful not to tow this line, and only include relevant topics that will also pick the interest of the stakeholders.
6. Summary
An all-inclusive summary of the key observations from the test goes a long way, hand in hand with the shared report, to save time, and excess resources especially when it can be quickly done in real-time to update on performance changes. This would be a better option than having them search for the specific information by themselves from the report.
7. Error Tracking
Another useful resource would be having a dedicated page for taking note of errors readily. From failed transactions, the time and data associated with the occurring error, to error snapshots, and the condition of servers during this time. The readiness of this mentioned information will assist in ensuring they are properly and quickly fixed.
8. Modeling
Using graphical visuals makes it easy to illustrate and explain the results being reported while giving a clear idea on where and what the issues are, how it’s either getting worse or better and also gives a good side-by-side comparison with earlier releases.
9. Presentation
The Last Step is to Present an easily comprehensible Result Report,
- Prepare a few pages (5-10) slides,
- Call for a general meeting with all the team members, stakeholders and present the useful results,
- Breakdown and relay your suggestions where needed,
- Don’t leave out the possible risks involved, and possible solutions.
An Example of Performance Test Reporting for Load Testing
Here’s a real analysis of performed load testing prepared and conducted by UTOR performance engineers. We’ll demonstrate only a part of it. You can download the full Performance Testing Results Report.
Scenario 1. Normal operation without exceeding the limits
- 1000 users log into the site at the same time
- All users check tasks every 1 – 10 seconds.
- Users mark tasks as completed
- Users periodically make transfers
Expected result:
Answers to API requests are received correctly, the response delay is no more than 5 seconds.
Testing results: Scenario 1
Start: 10.23.2020, 10:57
End: 10/23/2020, 11:03

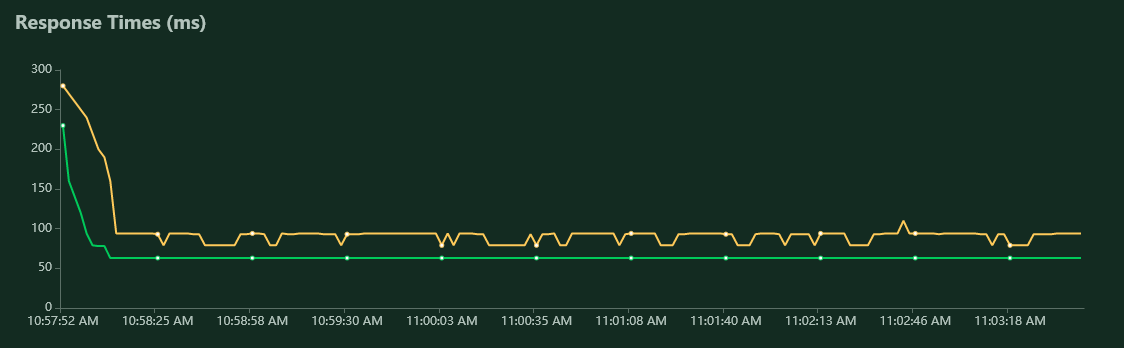

Statistics on requests
| Method | Name | 100% (ms) |
| POST | /auth/login | 330 |
| GET | /user/notifications | 200 |
| POST | /user/payment/p2p_confirm | 280 |
| POST | /user/payment/p2p_start | 420 |
| GET | /user/stats/counters | 160 |
| POST | /user/tasks/0/check | 140 |
| GET | /user/tasks/done | 270 |
| GET | /user/tasks/instructions | 160 |
| POST | /user/tasks/replace | 620 |
| GET | /user/tasks/todo | 330 |
| Aggregated | 620 |
Slowest API point is / user / tasks / replace (0.6 sec)
Error 500:
| Number | Point of failure |
| 42 | /user/tasks/done |
| 49 | /user/tasks/instruction |
| 94 | /user/tasks/replace |
| 26 | /user/tasks/todo |
Total number of requests during the test: 10136
Conclusions for Scenario 1:
The time for processing requests does not exceed the expected results.
Recommendations:
Make an audit of the code by points giving an Error 500 answer, optimize the point /user/tasks/replace
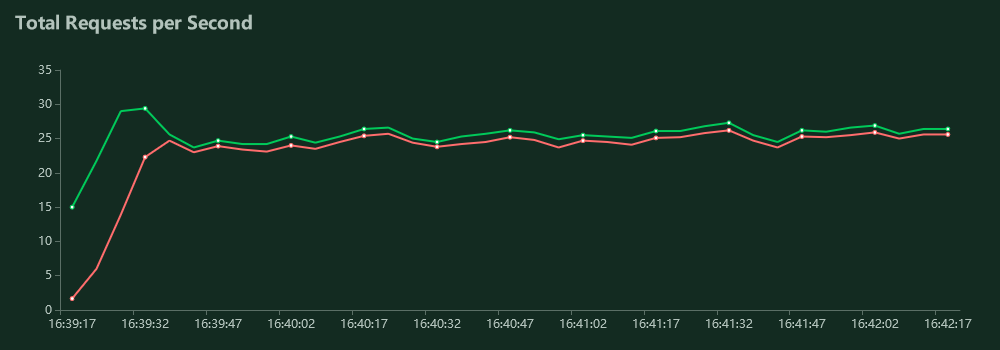
Scenario 1 (again, after updating)
Start: 2020-10-23 16:39:12
End: 2020-10-23 16:42: 09
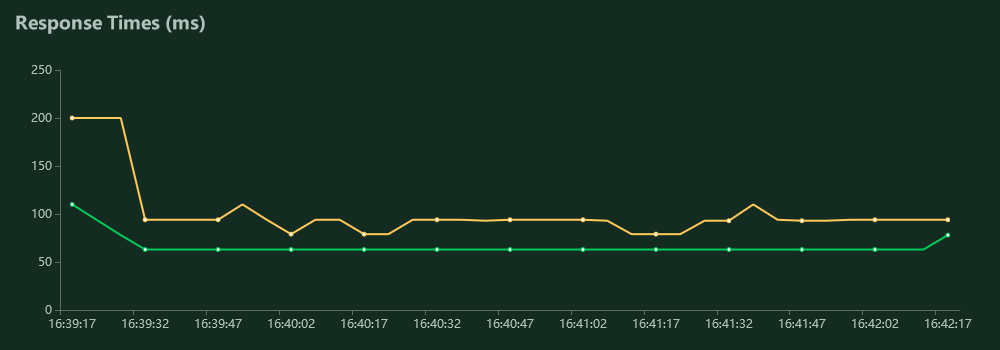
Statistics on requests:
| Name | 50% (ms) | 100%(ms) |
| /auth/login | 170 | 250 |
| /user/notifications | 63 | 140 |
| /user/payment/p2p_confirm | 63 | 120 |
| /user/payment/p2p_start | 63 | 140 |
| /user/stats/counters | 63 | 160 |
| /user/tasks/12345/check | 63 | 200 |
| /user/tasks/806049/check | 63 | 94 |
| /user/tasks/839699/check | 78 | 94 |
| /user/tasks/839700/check | 78 | 110 |
| /user/tasks/839710/check | 78 | 110 |
| /user/tasks/done | 62 | 140 |
| /user/tasks/instructions | 63 | 170 |
| /user/tasks/replace | 63 | 140 |
| /user/tasks/todo | 63 | 270 |
| Aggregated | 63 | 270 |
Slowest points: /user/tasks/todo and /auth/login
Error 500:
Not detected
Conclusions on Scenario 1 (again, after updating):
The time for processing requests does not exceed the expected results.
Putting together a Balanced Performance Report
Different projects would require different methods of approach to building a performance testing results report, depending on the size and number of test runs involved.
Looking at the number of team members and stakeholders that the report will be sent out to, is also one factor. These (and not limited to them) may be good reasons to take on a different manner of approach in performance test results reports. What should remain constant is the technical knowledge and experience as a performance tester.
What’s Next?
Keeping these factors in mind, how far or close are you to reporting your test’s efficiency? Even though you have learned how to report performance testing results, can you implement it in real-life? If not, find out about our QA processes, which we deploy during software testing.
")
")
")
")
")
")

&p[summary]=<p>Are you trying, but failing, to track your performance test results? Want to know how best to draft a performance testing results report? Check out this article.</p>&p[images][0]=https://u-tor.com/wp-content/uploads/2021/02/business-report-graphs-charts-business-reports-pile-documents-business-concept-min-2048x1365-1.jpg)
Thank you for the insightful article, please can you provide a link to download the performance test result report, thanks.