
Software development complexity reaches new heights, requiring even more comprehensive approaches to quality assurance (QA) and a great deal of planning. Establishing QA shouldn’t be taken lightly: do it wrong, and you’ll blow your budget fairly quickly. But do it right, and it will totally pay off!
Every CTO needs clear indications as to what will be tested (you can test quite a bunch of different things!) and how much time it will take specifically. That’s why you need the testing metrics in the first place.
At UTOR, we know it’s the return-on-investment (ROI) your CTO is concerned with when it comes to software testing. When we take on a new project, we always talk through the metrics and KPIs with our clients first.
We’re happy to discuss your project whether you want us to do software testing or need a professional consultancy. Or you can just keep going if you feel like doing it all on your own!
Test Metric Types In QA
Software testing metrics are quality indicators that measure results based on the specific data accessed. Metrics can also vary depending on the area of application and the QA roles and responsibilities.
QA Success Metrics
First thing first, before committing fully to your QA efforts, define clear metrics by which you could judge the success of the outcomes. There are two basic ways you can go about doing this.
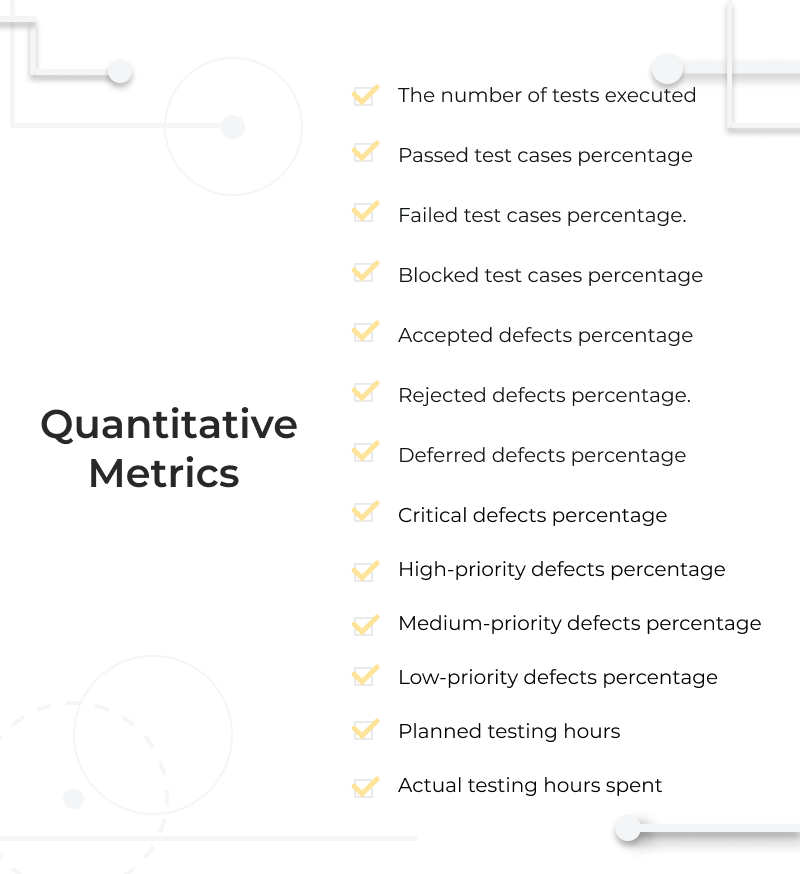
Quantitative Metrics
Quantitative metrics are the ones that can be measured precisely. They can be used both as absolute numbers and derivative metrics. Below are some of the common examples.
- The number of tests executed. This metric shows the total amount of tests run by the QA team.
- Passed test cases percentage. This metric is about the portion of tests executed by the QA team successfully.
- Failed test cases percentage. This one marks the percentage of tests that resulted in an unexpected failure which is not the result of the code discrepancy. That can happen due to environmental influence (for example, a strong magnetic field) or if the user triggers a system’s not intended response.
- Blocked test cases percentage. Depending on whether you’re dealing with manual or automated testing, it can mean slightly different things. It’d typically mean that a QA specialist couldn’t execute the whole sequence of the required actions in the manual testing. In automated testing, on the other hand, that can also be the case when the system passes the test. Still, a QA engineer registers an invalid result because parameters were beyond the scope of a given task.
A defect is a deviation from the intended software behavior that is discovered in the production environment. Not to be confused with bugs that typically occur during the pre-production period.
- Accepted defects percentage. That means the percentage of accepted valid defects by the software development team.
- Rejected defects percentage. Not all defects get accepted by the development team for various reasons. Most often, that happens if the development team doesn’t understand the nature of the defect, so further clarifications are needed.
- Deferred defects percentage. Sometimes, defects can be scheduled to be fixed upon the next release cycle. That may happen when fixing a specific defect is not a priority at the time.
Defects can also be prioritized so the software development team can work on them in the order of their importance.
- Critical defects percentage. Critical defects, by definition, are such that require immediate attendance: they create a roadblock for the rest of the team.
- High-priority defects percentage. These come right after the critical defects. In other words, the team should attend to high-priority defects as soon as the critical ones are fixed. As a matter of rule, high-priority defects must be fixed upon the upcoming release.
- Medium-priority defects percentage. Defects that affect minor functionality can be categorized as medium-priority defects.
- Low-priority defects percentage. Cosmetic damage and minor UI defects typically fall into this category. However, there might be occasions when even cosmetic damage becomes a high-priority or critical defect. Think of a typo in your company’s name and the damage it might cause to the business’s reputation.
Hours spent is another important marker of the QA team’s performance. The most indicative ones are the planned and the actual hours spent.
- Planned testing hours. These are the hours that the team is planning to spend on a specific scope of tasks. This is a retrospective metric that’s based on the previous team’s performance.
- Actual testing hours spent. This one is pretty much what it sounds like, the exact amount of time spent.
Overall, quantitative metrics give you a bigger picture as far as the efficiency of the QA team is concerned. You could either use absolute numbers to get a general idea or derivative metrics and measurements in software testing. In general, the higher the percentage ratio for any performance-based metric (for instance, the percentage of tests accepted), the more effective QA is. In fact, 90% is industry standard.
Quality Metrics
Quality metrics help you access the qualitative aspect of your QA efforts, saying how good a specific process was. It also provides consistency as the quality management system
Test effort
This set includes quite a few derivative metrics, so here are some examples.
- Number of tests executed. This metric tells you the density of tests run by a specific time period. It’s calculated as the ratio between the titan number of tests run and the total amount of working hours spent.
- Bug find rate. This one helps you estimate how frequently bugs are discovered within the time allocated for testing. Calculate it by dividing the total number of bugs by the total testing hours.
- Average time to test a bug fix. Since we’re testing bug fixes, that means we’re talking about retesting. The formula here is the following: divide the number of bug fixes by the total testing hours.
Test Effectiveness
How would you define whether testing was effective or not? Well, the ultimate goal of the QA team is to discover as many bugs and defects as possible before deploying the product to a client. So here is how you measure it: divide the total number of bugs (or defects) found during the testing by the sum of the total number of bugs and bugs found after deploying. And that’s how you get your rate.
Test Coverage
Software test coverage metrics are pretty much your progress bar: it shows you how much has been tested already.
There are quite a few things you can test: that can be requirements or test cases coverage, for instance. To give you an example: for calculating requirements coverage, you’d need to divide the tested requirements by the total number of requirements yet to test.
Quality metrics matter just as much and should correspond to quantitative metrics. Having a low quantity metric for a corresponding quality metric doesn’t make sense and can signify that you don’t have enough data.
Testing Metrics Based on the Type of Testing
In the previous section, we talked a lot about how to measure the effectiveness of your QA team. In this section, we’ll switch the angle and dive into the testing metrics for analysis in software testing based on the type of testing.
Performance Testing Metrics
Performance testing metrics help you access the most critical product aspects. You can measure your app’s efficiency against speed, reliability, and convenience.
- Requests per second (RPS). This metric measures the number of HTTP requests, images, libraries, CSS files a user attempts to pull from the server. The more elements the browser is trying to render, the higher RPS would be.
- Transactions passed/failed. Complex applications typically feature application programming interfaces (APIs) to access third-party services. As simple as it is, this metric gives you a general idea of how well those transactions come through.
- Peak response time. The response time varies, depending on the number of obstacles. So it’s essential to keep track of not only your average response time but a peak response time as well. That’s how you know your app’s limits.
- Concurrent users. This metric is loosely based on a load test where the maximum number of virtual users accessing the application simultaneously is measured. However, a test load doesn’t necessarily reflect the actual amount of users the app can handle. In real life, some users generate more requests than others, so keep in mind this metric is not 100% accurate.
The above-mentioned software performance testing metrics are only a sample.
Regression Testing Metrics
Regression testing is carried to ensure no critical functionality is affected after the major code changes. Since some metrics are commonly used in different types of software testing, we’ve already mentioned software test coverage metrics and defect priorities. Now let us talk more about what hasn’t been covered yet.
- Defect rate. This rate reflects the percentage of tests that haven’t been successful for one or another reason (like blocked tests, as we mentioned earlier). Defect rate is the ratio between the amount of failed tests and the overall number of tests executed.
- Defect age. As the name suggests, it’s the amount of time defect “lives.” Some fixes can be scheduled for further releases, which certainly adds up to the defect age. The moment the defect was discovered is the starting point, while the defect fix date is the finale.
- Test execution status. Tests are usually planned in advance. As testing proceeds, you can track completion by dividing the number of tests run by the total amount of tests scheduled.
Usability Testing Metrics
Usability testing tends to be more expensive since you can’t get away with it without having a focus group. It can be debated whether usability testing would generate better ROI than other types of test metrics in software testing though. However, there’s one thing usability testing does for sure – helps avoid biased opinions.
Remember how many times have you been discussing with your designer that weird-looking button? To find a middle ground, you need a third (or even more!) opinion. Usability testing involves a group of people that is given a set of tasks to complete.
Measuring results would typically involve such merits as success rate, the error rate, time to complete a task, user satisfaction level, among various metrics used in software testing.
The way the merits mentioned are calculated is defined on a case-by-case basis (in particular, the success rate may somewhat vary depending on the project objectives).
What’s the Difference Between Software Quality Metrics and Test Metrics?
Software quality metrics and test metrics are two different beasts. The first one defines the quality of the application tested, while the other one helps measure the effectiveness of the QA team efforts.
Software quality metrics go as far as the efficiency of the software development team and the product they create is concerned. This set of metrics will tell you many things, starting with how much time team leads dedicate to generate new ideas and ending with customer satisfaction. That should give you a bird view of a project!
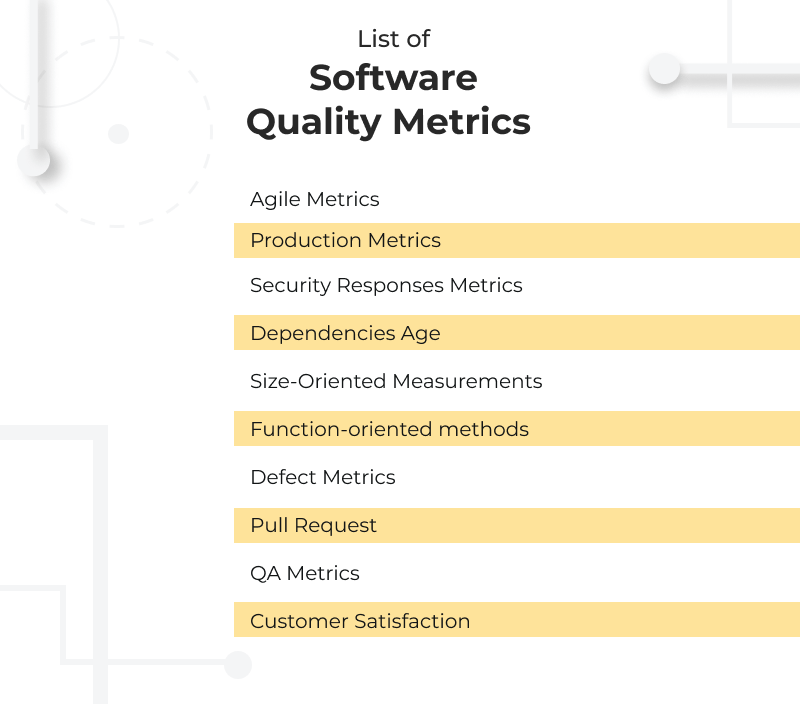
To measure test metrics, you’d be looking at test coverage, test effectiveness, test effort metrics, and such.
Why You Should Start Tracking QA Metrics
QA metrics help you understand how good your QA and the software development team are at what they do. As an executive, you wouldn’t only get a generally better idea of ROI (as we mentioned earlier) but would also be able to spot some weaknesses.

All of a sudden, you might discover that your departments are siloed, your processes are ineffective, and software tooling is outdated!
KPIs to Watch Out: UTOR’s Pick
KPIs can vary greatly from project to project, but here are some of the favorites that never failed us. Here is our choice of KPIs for the quality assurance department.
- Regression ratio. This one helps to identify potential bottlenecks: it tells how much time the QA team spends on testing and retesting existing functionality. It’s calculated as the ratio between the existing functionality’s defects and the overall amount of defects in both new and existing functionalities.
- Retesting ratio. This metric tells how much time the quality team spends on testing bug fixes. The low indicator might give some grounds to suggest that the software development team has some issues with processing bugs.
- Average cost of bug fix. This one is fairly simple: you divide the costs of bug fixes by the overall amount of bugs. That should give you an idea about what it costs to fix a bug on average.
- Error rate. This metric helps you access the skills of every software development team member. You calculate it by dividing the code errors of a certain developer by the overall amount of errors. If any specific developer has a substantial error rate, it might indicate that they are not up for a task.
- Test set efficiency. It shows how the number of bugs discovered correlates with the number of test cases done and is calculated as the ratio between the two.
- Defect rate. This is the number of defects discovered after the product has been released. It’s measured as the ratio between the number of defects discovered after the release and the general amount of defects found during pre- and post-production. You can’t have a large defect rate!


 and a great deal of planning. Establishing QA shouldn’t be taken lightly: do it wrong, and you’ll…</p>&p[images][0]=https://u-tor.com/wp-content/uploads/2021/08/cover-software-testing-metrics.jpg)